After reading this article you will learn about the calculation of slacks and floats with the help of examples.
Float and slack both refer to the amount of time by which a particular activity or event can be delayed without affecting the time schedule of the network. The term float is used for activities while slack is used for events.
Calculation of Floats:
Float is defined as the difference between the latest and earliest activity time. Float is the length of the time available within the estimated times of the noncritical activities.
There are three types of Floats:
(i) Total Float:
It is defined as the amount of time by which the completion of an activity could be delayed beyond the earliest expected completion time without affecting the overall project duration time.
Mathematically the total float of an activity (i,j) is the difference between the latest start time and earliest start time of that activity.
Hence, the total float for an activity (i,j) denoted by (TF)ij is calculated by formula
ADVERTISEMENTS:
(TF)ij = (Latest start) For activity (i,j)
(TF)ij = (LS)ij = (FS)ij
= (Lj – tij) – FSij
= (Lj – Ei) – tij
ADVERTISEMENTS:
Where,
Ei = Earliest expected completion time of tail event
= Earliest starting time for an activity (i,j)
and Lj = Latest allowable completion time of head event
ADVERTISEMENTS:
= Latest finish time of an activity (Cij)
This is the most important type of float as it concerns with the overall project duration.
(ii) Free Float:
This is concerned with commencement of subsequent activity. It may be defined as the time by which the completion of an activity can be delayed beyond the earliest finish time without affecting the earliest start of a subsequent activity.
ADVERTISEMENTS:
Mathematically the free float for activity (i,j) denoted by (Ff)ij can be calculated by the formula
(Ff)ij = Earliest went time for subsequent activity
j – Earliest event time for activity 0 – Activity time (ij)
= (Ej – Ei) – Tij
= Min {ESij for all immediate successors of(i, j)} – EFij
(iii) Independent Flout:
This is concerned with prior and subsequent activities. It may be defined as the “amount of time by which the start time of an activity can be delayed without affecting the earliest start time of any immediately successor activities, assuming that the preceding activity has finished at its latest finish time”.
Independent float of an activity (i, j) is given by
Independent float (IF)ij = (Ej – Li) – tij
Calculation of Slacks:
Slack is defined as the difference between the latest and the earliest event time. It gives the range of time available at an event for accomplishing an activity without delaying the project completion date.
Mathematically,
slack for event i = Li – Fi
The various floats and slacks for an activity (i,j) can be represented on a time scale as shown in following fig.
Example 1:
A project schedule has the following characteristics:
From the above information you are:
1. Construct a network diagram
2. Compute the earliest event time and latest event time
3. Determine the critical path and total project duration
4. Compute total and free float for each activity.
Solution:
1. First we construct the network with the given constraints:
2. To determine earliest event time & latest event time, we proceed as follows:
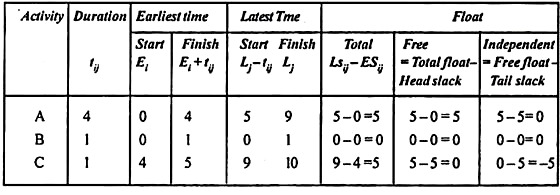
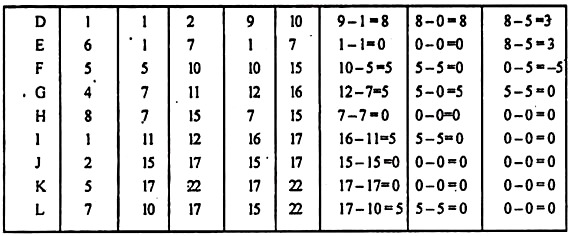
3. The critical path of the project is 1-3-5-7-8-10 and in the network diagram has been shown by double lines joining all those events where the two values Ei and Li are equal. The critical activities are B, E, H, J, K.
The total project time is = 1+6+8+2+5
= 22 units
4. For each non-critical activities, the total float, free float and independent float calculation are shown below:
Example 2:
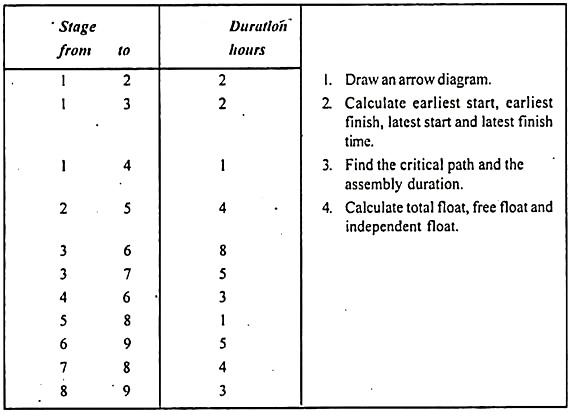
A small assembly plant assembles PCS through a interlinked stages according to adjoining precedence process.
Solution:
1. The network based on the data is as follows.
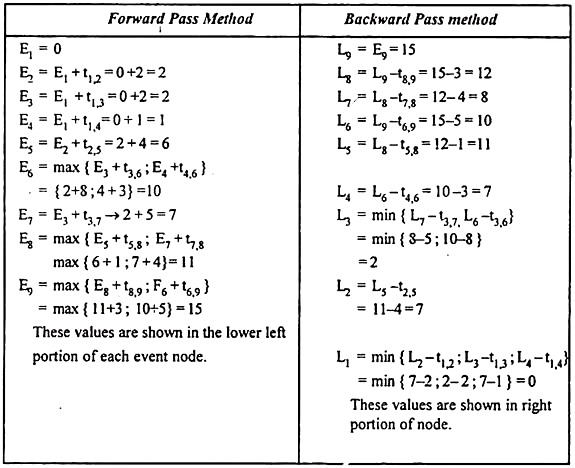
2. To determine earliest start time and latest finish time proceed as follows.
3. Computation of Time estimates & floats.
(i) Critical path is 1-3-6-9 with duration of 15 hours
(ii) Total float, free floats and independent floats are given in the last three columns of above table,
Example 3:
Tasks A, B —- H, I constitute a project. The notation X< Y means that the task X must be completed before Y is started. With the notation.
A < D, A < E, B < F, D < F, C < G, C < H, F < 1, G < I
Then
1. Draw a network diagram
2. Find the minimum time of completion of project when the time of completion of each task is as follows.
Solution:
The above constraints can be given in the following table:
Floats calculation:
To evaluate the critical events all these calculations are put in the following table:
The above table shows that the critical events are the tasks 1- 2, 2 – 3, 3 -5, 5 – 6 as thus total float is zero. The critical path is given by 1-2-3-5-6 or A-D-F-I with the total project duration as 44 days.
Example 4:
The following table gives data on normal time, cost, crash time and cost for a project:
Indirect cost is Rs 50 per week.
(a) Draw the network and identify the critical path with a dark line.
(b) What are the normal project duration and associated cost?
(c) Find out the total float associated with each activity.
(d) Crash the relevant activity systematically and determine the optimal project completion time and cost.
Solution:
(a) Network for the given project is drawn below:
(b) Time Estimation:
Earliest and latest time value for each activity as given in the table:
... Critical path is shown in following network diagram:
Earliest and latest time value & total float are calculated as follows:
Hence critical path for normal network is 1-2-5-6-7-8 along which activities have ‘o’ total float.
Normal project duration = 3 + 9 + 6 + 4+ 10 =32 weeks
Normal cost of project = Direct normal cost + Indirect cost for 32 weeks
= 4320 + 50 x 32 = Rs 5920.
For critical activities cost slope is given in table below from which we can see minimum cost slope is 45 for two activities 2-5 and 5-6. Hence, we have to crash activity 2 – 5 by 2 weeks from 9 weeks to 7 weeks. But in this case path. 1-2-4-5-6-7 will become parallel to critical path. Hence reducing activity 2 – 5 by only 1 week.
New, network diagram is shown in following Fig:
New critical path are 1-2-5-6-7-8 or 1-2-3-5-6-7-8 along which project duration is 31 weeks. New project cost after crashing activity 2-5 is = Direct cost + Indirect cost for 3 weeks = (4320+1 x45) + 50×31=Rs 5915
Now with respect to new network diagram value of cost slope are shown in following table:
Here minimum value of cost slope is 45 for activity 5-6. Hence crashing activity 5-6 by 2 weeks from 6 weeks to 4 weeks.
New network is shown in following fig:
Since activity 5 – 6 is common in both critical paths, thus critical path will remain unchanged. New length for critical path will be 29 weeks.
And new project cost is
=Total direct normal cost + Increased cost due to crashing of 5 – 6 & 2-5 + Indirect cost for 29 weeks
= 4320+1×45+2×45 + 50×29
= Rs. 5905
With respect to new network shown in above fig possibilities for crashing in critical path are listed in following table.
Here minimum cost slope is for activity 6 – 7 but crashing of 6 – 7 from 4 weeks to 3 weeks will increase the project cost as compared to, we have obtained in cost step. Therefore, optimal project duration is 29 weeks with associated project cost of Rs. 5905.
Example 5:
Following are the manpower requirements for each activity in a project:
Draw the network diagram of the project activities. Rearrange the activities suitably for reducing the existing total manpower requirement.
Solution:
Network diagram for given project is shown in following fig. Number in bracket represents manpower requirement of the activity.
Earliest and latest time values for each activity of network is calculated in following table:
Hence critical path for given network is 0 -1- 3-5 -1-9.
The project duration is = 2 + 4 + 4 + 6 + 4 = 20 days
A time-scaled version of given network is shown in following Fig. For that all critical activities are drawn in a straight line while other activities are added with it. Here it is assumed that various activities start at their earliest start time.
Time scale graph (Squared network):
A resources histogram of this squared network is shown below by taking earliest time of events on X=axis and manpower requirement on Y=axis.
From this histogram, we can see that maximum demand of manpower occurs during 15th and 16th day is 15 men.
Now to rearrange the manpower requirement shifting performance of some non-critical activities, as they have slack so their shifting will balance the manpower requirement.
To reduce the manpower requirement in initially and to raise it in last weeks, we can postpone the beginning of activity 3 – 6.6 – 8 and 8-9 each by 2 days so that all start on the beginning of 8th, 11th and 16th day respectively and that of activity 4 – 7 by 3 days to start on 10th day. The result of rearrangement is shown in above Fig.
The resource histogram for this time scaled graph is shown in below Fig:
This diagram indicates that requirement is less uneven in comparison to previous situation shown in above fig and maximum manpower requirement is 11 instead of 15.


