An Ideal gas is one which obeys all the gas laws and the characteristic gas equation PV = RT at all temperatures and pressures.
But actually there is no ideal or perfect gas in reality. But all the real gases like Air, O2, N2, H2, He behave as ideal gases at very low pressures and high temperatures.
So a real gas does not obey gas laws PV = RT for the entire range of pressure and temperature except when the pressure tends to zero and at a very high temperature. However real gas behaviour deviates from perfect gas equation at high pressures and low temperatures.
In order to study the behaviour of real gases under all the conditions of pressures and temperatures Van der Waals’ equation is most commonly used.
Van der Waal’s Equation of State:
ADVERTISEMENTS:
The ideal gas equation PV = RT is developed from kinetic theory of gases and is based on two important assumptions viz.:
(i) There is very little or no attraction between the molecules of the gas.
(ii) The volume of the gas molecules themselves is very small compared with the total volume of gas.
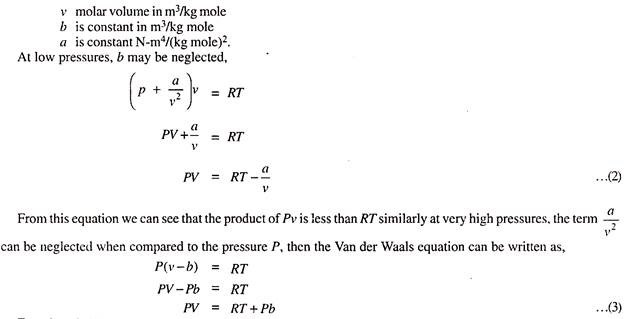
At low pressures and at very high temperatures, the intermolecular attractions and the volume of molecules compared to total volume of gas are not of much significance and the real gases obey the ideal gas equation. But when the pressure increases, the intermolecular attraction and the volume of the molecules becomes considerable when compared to total volume of gas. Then the real gases deviate from the ideal gas equation.
ADVERTISEMENTS:
So, Van der Waal suggested the corrections for the ideal gas equations, so that it can be used for real gases at all pressures and temperatures.
Correction for Intermolecular Attractive Forces:
To find a correction term for intermolecular attractive forces of the molecules, let us consider the molecule A, which is surrounded by the other molecules as shown and is attracted equally in all the directions and is in equilibrium. If we consider the molecule B, which is about to strike two walls of the containing vessel. Then this molecule will strike with less velocity or less momentum because of attractive force of the molecules on the inner side. When the momentum or velocity is less, then the pressure exerted by the molecules is less.
Van der Waal experimentally found that this decrease in pressure because of molecular attractive force is proportional to the square of the molal density i.e., Decrease in pressure α (Density of gas)2.
This correction is to consider the self-volume of the gas molecules, which is generally neglected in comparison with total volume. To correct this self-volume, Van der Waal experimentally found and suggested, that specific volume in ideal gas equation must be replaced by (v – b). Where constant b takes care of reduction in volume due to finite size of molecules.
When we consider both these corrections, the equation of state for the Real gases can be written as,
Equation (3) is known Clausius Equation of State and it can be seen that the product of pressure and volume PV is more than RT.
Determination of Constants of Van der Waal’s Equation:
Even though the Van der Waal’s equation is generally used for real gases, it has some limitations, that is the constants a and b vary with temperature and pressure. One of the methods generally used to find the value of the constants a and b is based on the fact that in case of real gases the critical isotherm on P-v diagram has zero slope at critical point.
It is to be noted that the properties at the critical state are known as critical properties such as critical pressure PC, critical temperature TC critical volume vC.
Since the critical isotherm has zero slope at critical point, we can write,
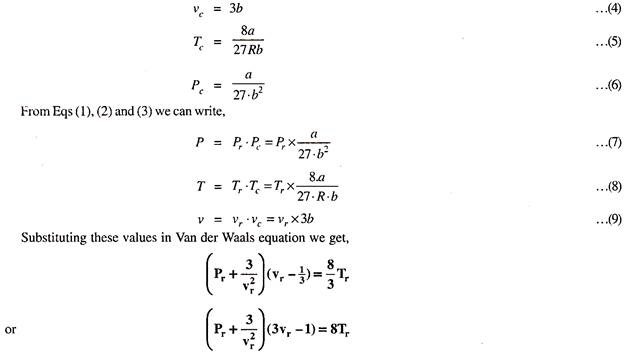
Equations (4), (5) and (6) give the values of critical properties.
Because of practical limitations it is very difficult to measure the critical volume. So, the constants a and b are generally expressed in terms of Tc and Pc.
From Eqs (5) and (6) we get,
So, the ratio of PV/RT at critical point is a constant 3/8 is same for all real gases and is unity for ideal gases.
Table below gives the constants of Van der Wall’s equation.
Reduced Co-Ordinates (Van der Waal’s Equation) in Reduced Co-Ordinates:
The properties at the critical state are known as critical properties such as critical pressure Pc, critical temperature Tc, critical volume vc.
Reduced co-ordinates or properties are defined as those properties which are obtained by dividing co-ordinates/properties by corresponding co-ordinates/properties at the critical state for example,
The Relationship between Reduced Co-Ordinates is known as the Law of Corresponding States:
We know from Eqs (4), (5) and (6)
This is the Van der Waal’s equation in terms of reduced co-ordinates and it is independent of R, a, and b.
Compressibility Factor, Compressibility Chart and Generalised Compressibility Chart:
Compressibility Factor:
The deviation of real gas from ideal gas is measured by a factor known as compressibility factor Z, and defined as the ratio of the actual volume to the volume predicted by the ideal gas law at the same temperature and pressure is given by Z = Actual volume/Volume predicted by the ideal gas = v/RT/P
But RT/P is the ideal gas volume Videal. So, compressibility factor may also be defined as, the ratio of specific volume of real gas to specific volume of ideal gas i.e.,
As we know all the gases behave as ideal gases at very low pressures and high temperatures. So when the pressures are lowered, then the value of Z tends to unity as the gas behaves as ideal.
It is to be noted that the value of Z may be less than unity or greater than unity depending upon the pressure and temperature. Figure 6.4 shows the compressibility factor chart which shows the values of Z corresponding to pressure.
Note that a graph of compressibility factor Z versus Pr for different values of Tr for different gases is known as Generalised Compressibility Chart which is shown in Fig. 6.5.
Van der Waal’s Principle:
While studying reduced co-ordinates we have studied that the relationship between reduced properties (i.e., Pr Tr and vr) is known as Law of corresponding states.
As we all know that all the substances exist in solid, liquid or gaseous phases and they have critical point and triple point.
And Van der Waal suggested that P v T relationship can be shown by a single model and he has used critical point as reference point and critical properties as reducing properties and the principle of corresponding states may be expressed as,
This is another form of Van der Waal’s equation.
The Beattie-Bridgeman Equation of State:
This equation is proposed in 1928, it has five constants which have to be determined experimentally.
This equation is given as below-
Constants of the Beattie-Bridgeman equation of state.
Virial Equation of State:
We know that the equation of state of a substance is PV = RT and may be expressed as,
Then this equation is known as Virial Equation of state. And the co-efficient a (T), b (T), c (T) which are the functions of temperature are called as Virial Co-efficient.
P-v-T Surface of an Ideal Gas:
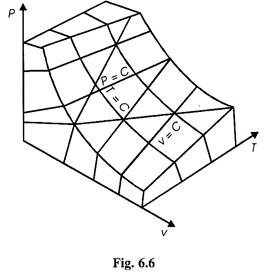
We have studied the equation of state for ideal gases and real gases. These equations contain three variables P, v, T. If we plot these three variables along the three mutually perpendicular axes, then a surface is developed and is known as P-v-T surface.
Figure 6.6 shows the P-v-T surface of an ideal gas. On this figure constant pressure, constant volume, and isothermal lines are shown. It is to be noted that on this surface each point is an equilibrium state and the processes proceed from one equilibrium state to another equilibrium state till the end of the process and the processes are quasi-static.
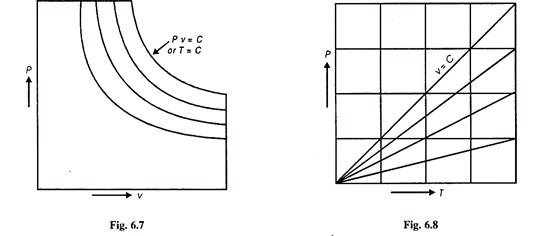
From Fig. 6.6 we can draw P.v and PT plans for an ideal gas as shown in Figs. 6.7 and 6.8.
Figure 6.9 shows the isothermal processes i.e., it graphically shows Boyle’s law whereas Fig. 6.10 shows graphically Charle’s law.
P-v-T Surface for Real Substance along with Pv and PT Diagrams for Real Substance:
To study P-v-T surfaces of real substance, water and CO2 are considered.
The important features of the two are:
(i) Water expands on freezing
(ii) CO2 contracts on freezing.
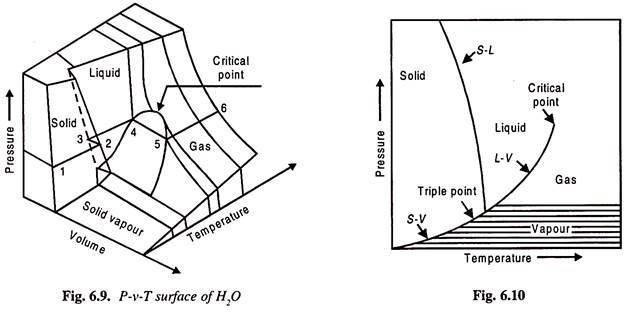
Figure 6.10 shows P. v. T surface of H2O. Also Figs 6.10 and 6.11 show PT and Pv diagrams.
Every point on the P-v-T surface is an equilibrium point and the processes are quasi-static.
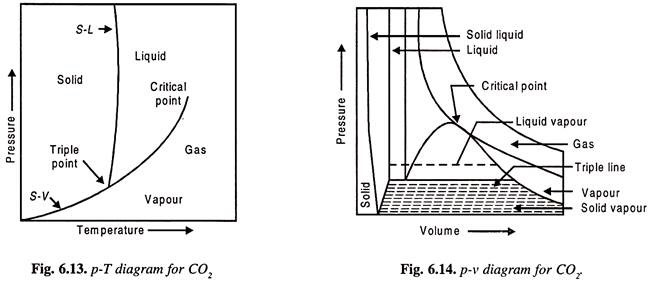
In certain portions the substance exists in single phase i.e., it may be solid, liquid or a gas and accordingly they are marked. And if the substance has two phases, then the region is marked as solid-liquid, liquid-vapour, solid-vapour.
Note that triple point line appears as a point on PT-diagram.
The line 1-2-3-4-5-6 is a constant pressure line on the P-v-T surface. To understand this, consider water in a closed vessel and let heat be supplied. The temperature of water will increase upto point 4 is reached. Then the steam generation starts. And the heat supplied is utilised for converting water into steam. Once the last particle of water is converted into steam the steam is known as dry saturated steam. After this point 5, if the steam is further heated, then it will be superheated along 5-6.
Figures 6.13 and 6.14 show P.v.T. surface for CO2 and PT and Pv.


