In this article we will discuss about:- 1. Conditions of Steam 2. Properties of Steam 3. Steam Tables 4. Internal Energy and Entropy 5. Phase Diagram for a Pure Substance 6. The P – V and T – S Diagrams for H2O (Vapours) 7. Mollier Diagram or Total-Heat-Entropy or Enthalpy-Entropy Diagram (h-s Diagram).
Contents:
- Conditions of Steam
- Properties of Steam
- Steam Tables
- Internal Energy and Entropy of Steam
- Phase Diagram for a Pure Substance
- The P – V and T – S Diagrams for H2O (Vapours)
- Mollier Diagram or Total-Heat-Entropy or Enthalpy-Entropy Diagram (h-s Diagram)
1. Conditions of Steam:
Steam may occur in any one of the following three conditions:
ADVERTISEMENTS:
(a) Saturated steam, which may be either dry or wet,
(b) Superheated steam and
(c) Supersaturated steam
(a) Saturated Steam:
ADVERTISEMENTS:
Saturated steam is a vapour at the temperature corresponding to the boiling point of the liquid at the given pressure. A substance, which is in the vapour state in a confined space and is in contact with some of the same substance in liquid state is always at the same temperature as the liquid and is saturated vapour.
If saturated steam does not contain any water, it is known as dry and saturated steam. It contains just sufficient heat energy to maintain all the water in a gaseous state.
If saturated steam contains liquid particles, it is known as wet steam. It does not contains sufficient heat energy to maintain all water in a gaseous state.
If some of the heat energy is absorbed from the dry saturated steam, the steam becomes wet. In practice it is difficult to get an absolutely dry saturated steam if it is produced by boiling water, because some of water particles are carried away with the steam.
ADVERTISEMENTS:
(b) Superheated Steam:
If the temperature of the steam is greater than that of the boiling point or saturation temperature corresponding to the pressure of steam generation, the steam is known as superheated steam.
The amount of superheat in the steam is given in terms of the difference between its temperature and that of the saturated steam at the pressure of steam generation. If the temperature of the steam is 100 degrees higher than the saturation temperature corresponding to the pressure of steam generation, we say that the steam has 100 degrees of superheat.
ADVERTISEMENTS:
Supersaturated steam at a particular saturation pressure has temperature less and density greater than the corresponding values given in the steam tables. This condition of steam is obtained when it is cooled by its own expansion until it contains less heat energy than the saturated steam under the same conditions. This state of steam is varying, unstable and the steam soon returns to the saturation condition. Such a state of steam occurs in expansion in a nozzle.
2. Properties of Steam
:
The properties of steam are interrelated. If we know certain properties, the other properties may be found out or derived. For example- if the pressure of saturated steam is observed by the pressure gauge, its temperature can be found from the steam tables in which the results of the various experiments have been tabulated.
(a) Dryness Fraction of Saturated Steam – We have seen that steam in contact with water contains liquid particles in suspension. Thus the steam consists of dry saturated and water particles in suspension.
ADVERTISEMENTS:
The dryness fraction of steam is defined as the ratio of the weight of dry steam in a certain quantity of steam to the weight of total wet steam. It is generally denoted by the letter x. If W is the weight of dry steam in the total steam Wt, then x = Ws/Wt.
The dryness fraction of a wet steam may also be defined as the amount of dry steam in unit amount of the steam. When x = 1, the steam is said to be dry and saturated.
(b) Sensible heat (hf)
(c) Latent heat or enthalpy of evaporation hfg
(d) Superheat and degrees of superheat
(e) Volume of wet steam: V = xVg
(f) Volume of dry and saturated steam: V = Vg
(g) Volume of superheated steam: Vsup = Vsat x (Tsup/Tsat) = Vg x (Tsup/Tsat)
3. Steam Tables
:
Experimentally, accurately determined, values are tabulated in tables that are called as Steam tables. These values form the basis for many calculations concerned with steam engineering. These tables are to be used because vapours do not obey general gas laws. The values given in the tables are for one kg of dry and saturated steam but these values can also be employed for wet steam calculations.
In order to determine the properties of steam at some pressure between those given in tables, we interpolate assuming the linear relation between these values. The method is very simple and at the same time accurate.
Method of linear interpolation to find, say, enthalpy at 10.2 bar pressure.
Difference between two values at 10 and 10.5 is 772.03 – 762.61 = 009.42 kJ/kg.
This is the difference for 0.5 bar pressure.
4. Internal Energy and Entropy of Steam:
Internal Energy of Steams:
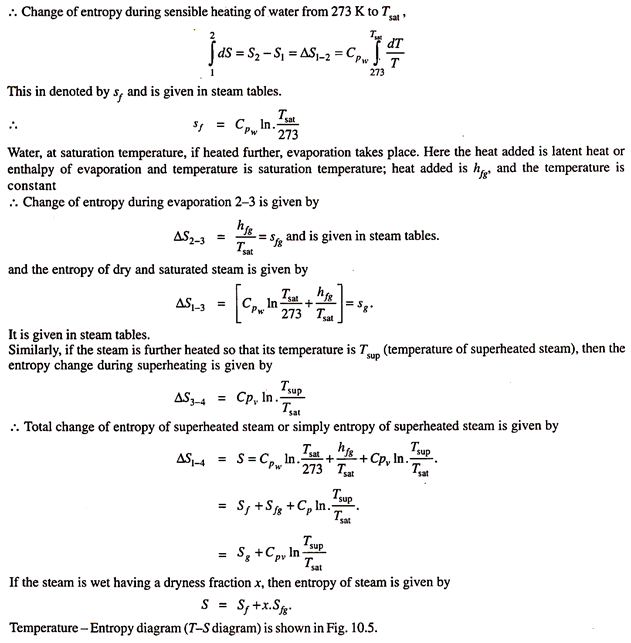
The change of entropy during any reversible process is defined as the ratio of heat added or rejected to the absolute temperature at which the heat is added or rejected.
We can apply the definition for getting entropy of steam above 0°C.
Consider one kg of water at 0°C and pressure p. Let heat be added so that the temperature increases to saturation temperature corresponding to pressure p. Here the temperature changes. Let during the heating, process, T be the temperature and an infinitesimal heat δQ is added and for the process 1–2; where the temperature changes from 0°C (273K) to Tsat (saturation temperature at p).
5. Phase Diagram for a Pure Substance:
Pure substance is a substance consisting only of a single molecular species such as He, H2, H2O or NH3, phases of these substances being different namely solid, liquid and gaseous.
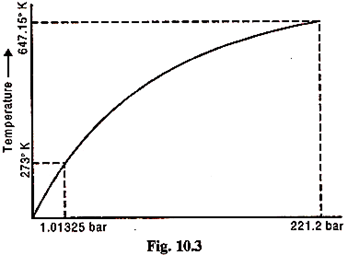
Figure 10.3 shows such a diagram where the phase changes are shown. Such a diagram is called a phase diagram for pure substance.
For a particular pressure, the horizontal line a, b, c, d, e is drawn as shown in Fig 10.6.
a = Solid state
b = Melting point of ice
c = Boiling or saturation temperature point, C does not apply to substance that expand on freezing
d = dry and saturation point d
de = Superheated vapour
bd = Liquid vapour region
This process is repeated at numerous pressure and the point analogous to b and d duly noted, say down to point B. A smooth curve through all the d points is the phase boundary between liquid and vapour; it is the locus of all points representing saturated mixtures. The smooth curve through all points b is the phase boundary for solid and liquid; points on this line represent all equilibrium mixtures of solid and liquid.
The states B and C in Fig. 10.6 are particularly significant. Point B, the junction of the three phase boundaries, is called the triple point because it represents all equilibrium mixtures of solid, liquid and vapour.
The critical point C where the curve BC ends is a state where liquid and vapour are indistinguishable. As this point is approached the latent heat of evaporation decreases. At C it is zero. The temperature TC here is called the critical temperature and the corresponding pressure is the critical pressure (PC). The specific volume at PC and TC is the critical volume.
Density of water and vapour at the point C is same.
For water, PC = 221.2 bar
TC = 374.15°C
VC = 0.00317 m3/kg
We know that to determine the temperature of any system, the thermometer must be brought to thermal equilibrium with an arbitrarily chosen standard system in an easily reducible state. The temperature of the standard system in the chosen state is called the fixed point.
Before 1954 there were two fixed points –
(i) The ice point and
(ii) Steam point.
The use of two fixed points was found unsatisfactory, partly because of the difficulty of achieving equilibrium between pure ice and air-saturated water. When ice melts, it sounds itself with pure water and thus prevents intimate contact of ice and air saturated water. Also the steam point is extremely sensitive to a change in pressure.
The temperature scale in use since 1954 is based on one fixed point only. This is the temperature at which ice, liquid water, and water vapour coexist in equilibrium, a state known as the triple point of water. The temperature of the triple point of water is the standard fixed point of thermometry.
The Celsius temperature of the triple point of water is 0.01°C and the pressure at triple point for water is 0.006114 bar.
6. The P – V and T – S Diagrams for H2O (Vapours):
P – V Diagram for Saturated Liquid and Vapour:
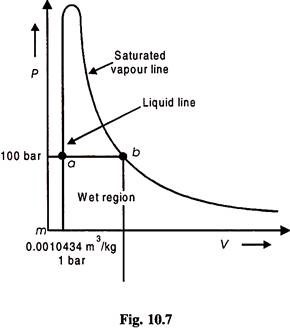
The saturated water curve (liquid line) is obtained by plotting – P and Vf values form the steam tables on P-V coordinates and T-Sf values on T-S coordinates. Similarly saturated vapour (steam) line or curves are obtained from steam tables.
(i) 221.2 bar,
(ii) 374.15°C,
(iii) VC = 0.00317 m3/kg,
(iv) Vb = 0.0014526 m3/kg,
(v) Va = 0.0014526 m3/kg.
Notice here that saturated vapour line flattens out towards the right, indicating that the volume increases at an increasing rate at low pressure.
In Fig. 10.7, m represents the state where Vf = 0.0010434 m3/kg at 1 bar pressure. C is the critical point where pressure is 221.2 bar, saturation temperature is 374.15°C and volume is 0.317 m3/kg.
This diagram is not used in practice but is useful in general to study the property relations and the vapour behaviour.
The Temperature-Entropy Diagram for Steam:
It is possible to plot on a Temperature Entropy diagram, a chart which gives the entropy of water and steam at all temperatures and pressures. Such a chart is very convenient for solving problems containing an adiabatic (reversible) expansion of steam. A Temperature Entropy Chart (T-S Chart) is plotted in Fig. 10.8 with co-ordinates representing the absolute temperature and entropy. The units of entropy are reckoned from the freezing point of water.
Consider 1 kg steam at absolute pressure P1, the absolute temperature of formation at this pressure will be T1; the value of T1 can be obtained from the steam tables.
Let this value of Sf1 be represent by ab to a convenient scale, and plot this distance on T-S diagram of Fig. 10.8. Repeat this for other pressure of steam and draw a curve through the points obtained. This curve is known as the saturation liquid line or simply liquid line. Sometimes it is also called water line and will give the values of Sf at all temperatures and pressure.
Again consider the steam at pressure P1. During evaporation the change of entropy of this steam will be –
Let this be represented by the distance bc and be plotted on the T-S chart. The point C will represent dry steam at pressure P1. Repeat this for other pressures and temperatures and draw a curve through the points obtained. This curve is known as the dry steam line, and its horizontal distance from the vertical ordinate represents the total entropy of steam at any pressure.
If the steam at pressure P1 had been wet, with a dryness fraction of x, the entropy of evaporation would be –
Let this be represented by bf and be plotted to the same scale. Then af is the total entropy of the wet steam, and the dryness fraction is the ratio of bf to bc.
Again, consider 1 kg of dry steam at condition c. Let steam be now superheated by increasing the absolute temperature from T1 to TS. Then, increase in entropy due to superheating is –
Let this increase of entropy be represented by the horizontal distance cd. Draw a horizontal through TS and a vertical through point d let these lines intersect at e. Then the point e represents the condition of the superheated steam at pressure P1. Repeat this for other valves of T’s the temperature T1 remaining the same, as the pressure is constant.
Draw the curve ce through the points so obtained. Then this curve represents the entropy of superheated steam at pressure P1, for all temperatures for superheat. Actually, the curve ce is a constant pressure line. Similar constant pressure lines can be drawn for superheated steam at other pressures.
It should be noticed that the area of the chart between the water line and the dry steam line represents wet steam. The area of the chart to the right of the dry steam represents superheated steam, and is known as the area of superheat, or superheat region.
Thus a complete T-S diagram for pressure P1 is shown in Fig. 10.9.
In this diagram, the evaporation lines bc at all pressure can be divided into ten equal parts. Curves can then be drawn through each corresponding tenth part of these lines. These curves represent the dryness fraction of the steam at any temperature and pressure. These curves or lines are known as constant dryness fraction lines. Thus, any condition of steam can be represented by a corresponding point on the T-S diagram. Such a point is known as state point.
Dryness fraction lines are shown on T-S diagram of Fig. 10.9.
7. Mollier Diagram or Total-Heat-Entropy or Enthalpy-Entropy Diagram (h-s Diagram)
:
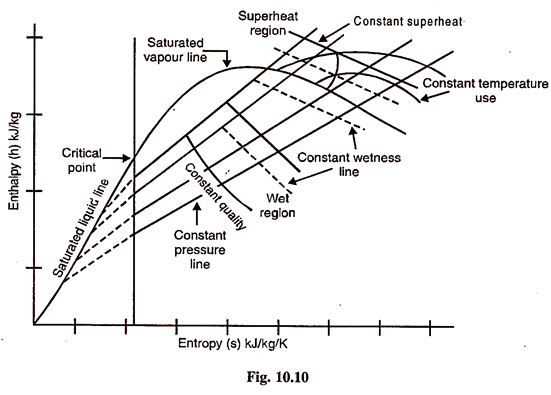
Another type of entropy diagram which is used by engineers is the Mollier diagram or Enthalpy – Entropy (h-s) diagram. This diagram represents the entropy and total heat or enthalpy of steam. It is shown in Fig. 10.10.
The base of the diagram represents the entropy of the steam and the vertical ordinate represents the total heat or enthalpy of steam. The lower portion of the diagram is the wet steam area, whilst the upper portion of the diagram represents the superheated condition of the steam.
Constant pressure lines are plotted on the diagram through both the wet steam area and the superheat area. Constant pressure lines are straight lines in the wet region and curved in the superheat area. Lines of constant dryness fraction are plotted in the wet steam area, and lines of constant temperature in the superheat area.
As the base of the diagram represents entropy of the steam, an adiabatic (isentropic) expansion will be represented by a vertical line.
Again a throttling expansion will be represented by a horizontal line on this diagram, as throttling process is a constant enthalpy (isenthalpic) or total heat process.
The main use of this diagram is for finding the drop in total heat or enthalpy of steam during an isentropic expansion. The final condition of the steam after expansion can also be read off from the diagram. The drop in enthalpy during an adiabatic or isentropic expansion. The final condition of the steam after expansion can also be read off from the diagram. The drop in enthalpy during an adiabatic or isentropic expansion of steam is known as isentropic enthalpy drop.


