In this article we will discuss about how to design bituminous mixes for construction of roads [with mix formula]| .
Design of Bituminous Mixes:
The steps in the design of bituminous mixes are:
Selection of Aggregate and Grading:
Aggregates which possess the desired qualities of strength, hardness, toughness, and soundness are selected. Crushed stone aggregates and sands of angular particles are considered to produce high quality mixes.
ADVERTISEMENTS:
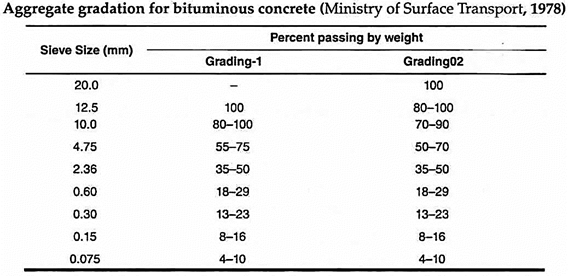
The grading of the aggregate is also chosen carefully; open grading with mixing sizes is not preferred as they produce inferior mixes. Higher maximum sizes can produce greater stability and is therefore preferred, consistent with the thickness of the pavement.
Based on experiments Ministry of Surface Transport (MOST), have recommended the following two gradations for a superior bituminous concrete pavement:
Note:
ADVERTISEMENTS:
The bitumen content recommended by weight of the mix is 5 to 7.5%. However, in any particular case, it has to be ascertained by the chosen mix design method.
Bulk Specific Gravity of the Aggregates:
The aggregates consist of coarse aggregate, fine aggregate and mineral filler material. The voids in the aggregate are filled partly by the bitumen binder and the rest by air.
If the percentages of weight of these are Wc, Wf and Wmf respectively, and their bulk specific gravities are Gc, Gf and Gmf respectively, the bulk specific gravity of the combined aggregate (Ga) is given by –
Preparation of the Test Mix Specimen:
The preparation of the test mix specimen depends on the mix design methods chosen. The specimens are moulded in accordance with the specification given in the particular design method.
The optimum bitumen for any mix has to be determined in accordance with the criteria specified by the particular authority adopting the mix design method, based on the results on the tests conducted in the laboratory on the test specimen.
However, the appropriate value of the optimum bitumen content for a chosen set of aggregates may be obtained from any one of the following two approaches:
ADVERTISEMENTS:
(i) Surface Area Approach:
The optimum bitumen content is taken to be a function of the surface area of the aggregates. This may be given by the following equation –
This approach is considered for low-cost roads.
ADVERTISEMENTS:
(ii) Air Voids Approach:
The amount of binder to be used depends upon the air voids in the aggregates and on the desired volume of voids in the final compacted mix. While the former is determined by the gradation and method of compaction, the recommended values for residual air voids range from 2 to 7%. For the design of dense bituminous mixes, this approach is preferred.
Determination of the Specific Gravity of the Compacted Test Specimen:
Bulk specific gravity of the compacted test specimen,
If the specimen consists of a porous surface, it may absorb water when it is weighed in water. To avoid absorption of water, the specimen may be coated with wax and a correction applied for the volume of the wax used for coating.
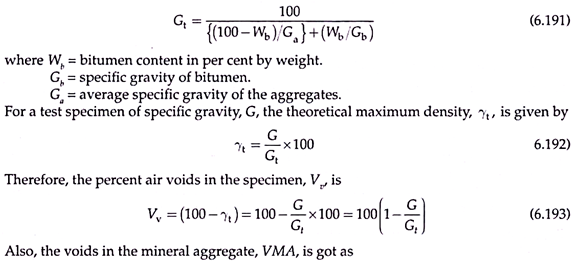
With known values of specific gravity of the mineral aggregate and bitumen, the theoretical maximum specific gravity of the mix, Gt, for a given bitumen content may be got using the relation –
Stability Tests on Compacted Specimens:
Stability tests are conducted on the compacted specimens based on the method of bituminous mix design chosen. The strain values at failure are also recorded for each of the test specimens along with the stability values (or the maximum load that could be applied just before failure of the test specimen.)
The optimum bitumen content is selected based on the results of the tests conducted on the specimens with different bitumen contents. The results of the tests are presented in the form of graphs for different parameters like stability value, flow value, unit weight, percentage of air voids in the mix, and percentage of voids filled with bitumen with varying bitumen content values.
These values are compared with the design criteria developed, and the optimum bitumen content is selected as the one which satisfies these criteria to the maximum extent.
Methods of Designing Bituminous Mixes:
There are three common methods of designing bituminous mixes:
(a) Marshall method
(b) Modified Hubbard – Field method
(c) Hveem stabilometer and cohesion-meter method.
The first one – the Marshall method is adopted by IRC and is presented here:
This method was developed by Bruce Marshall of the Mississipi State Highway Department (USA); it was modified and improved by the U.S. Army Corps of Engineers. Other agencies like the ASTM and AASHTO have standardised the test procedure and formulated the mix design criteria based on the results of these tests.
This method is considered to be suitable for hot-mix design with aggregates of maximum size 25 mm; it is the preferred method of design for superior and high quality bituminous pavements like bituminous concrete.
The steps in the Marshall method are given below:
Preparation of Test Specimens:
A number of specimens with different bitumen contents (at increments of 0.5% by weight) are chosen in a selected grade of aggregates (of maximum size 25 mm). About 1200 g of aggregates (coarse and fine aggregates and mineral filler material) is taken according to a standard recommended grade. The aggregates and bitumen are separately heated to a temperature of 154 to 160°C and 175 to 190°C, respectively. The quantity of bitumen by weight of the mix is measured and poured into the heated aggregate.
The mix is uniformly blended and poured into a standard cylindrical mould (102 mm diameter and 64 mm depth) heated to 93-149°C. It is compacted with 75 blows of a rammer of weight 4.54kg with a fall of 45.7 cm on each face. The specimen is allowed to cool to room temperature for 12 hours and then kept in a water bath at 60°C until 30 minutes before testing.
Testing the Specimens:
The sample is taken out of the water bath and diametrically placed in position as shown in Fig. 6.75.
A schematic of the Marshall Stability test set up is shown in Fig. 6.76.
The load is vertically applied on to the specimen at a constant rate of 5 cm/minute. The maximum load at failure is taken as the stability value (kN) and the corresponding deformation obtained from the dial gauge is taken as the Flow value (mm), which is expressed in units of 0.25 mm.
Presentation of the Test Data:
The data obtained from the Marshall tests are presented in the form of the following graphs:
(a) Unit weight vs. bitumen content
(b) Marshall Stability vs. bitumen content
(c) Air voids vs. bitumen content
(d) Percent voids filled with bitumen vs. bitumen content
(e) Flow value vs. bitumen content
Typical graphs of (a) to (e) are shown in Fig. 6.77.
Interpretation of the Graphs:
(a, b) Unit Weight and Marshall Stability vs. Percentage Bitumen by Weight of Mix:
These curves show similar trends. As the bitumen content increases, initially both the unit weight and Marshall Stability increase; after reaching a peak, they decrease thereafter. Initially, the bonding is less, but with more bitumen, the thickness of films does not allow effective load transmission.
(c) Air Voids vs. Bitumen Content:
Air voids content decreases continuously as bitumen increases.
(d) VBF vs. Bitumen Content:
VBF increases as bitumen content increases as most voids get filled.
Flow is a measure of deformation due to applied load. Flow increases with bitumen content because thick films of bitumen prevent strong aggregate interlocking.
Marshall Stability values are to be corrected if the specimen height is not exactly 634.5 mm.
Typical correction factors are:
Marshall Mix Design criteria for bituminous concrete:
Modified Hubbard-Field Method:
This method was developed by P. Hubbard and F. C. Field. The apparatus consists of a mould, 15.24 cm diameter, and other compacting devices like tampers, along with a compression testing machine of 5T-capacity. The specimen is loaded through a ring of internal diameter 14.6 cm as shown in Fig. 6.78.
The test briquette with the trial mix is made by pouring the mix of aggregates and bitumen, heated to the prescribed temperature, in two nearly equal layers, each tamped by 30 blows with a tamper. The specimen is tamped on the reverse side also by 30 blows.
Then, a static load of 4.536 t is applied onto the specimen for two minutes and cooled in water to about 37°C under the same load. The specimen is removed, measured and weighed (15.2 cm dia. and 7.6 cm high).
The specimen is placed in the test mould over the test ring of internal diameter 14.6 cm and the load is applied through the plunger. The assembly is kept at 60°C and the load is applied at a constant rate of deformation of 61 mm/min. The maximum load is noted as the stability value.
The test is repeated with other trial bitumen contents. For each value of bitumen content, the specific gravity per cent voids in the total mix are calculated.
The following graphs are plotted:
(i) Stability vs. bitumen content.
(ii) Unit weight vs. bitumen content.
(iii) Percent voids in total mix vs. bitumen content.
(iv) Percent aggregate voids vs. bitumen content.
Typical plots are shown in Fig. 6.79.
The criteria generally adopted for design of mix are stability value (kg) and percentage of voids in the total mix. Both these values should be in the prescribed limits for the particular traffic ranges for the chosen bitumen content.
The design is adopted by trial and error after establishing these plots.


